
About
System Monitor
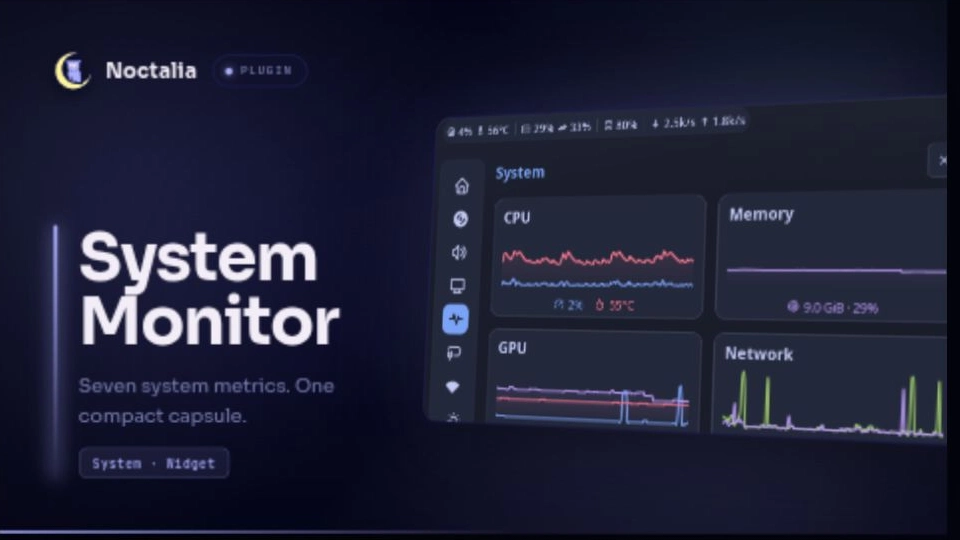
System Monitor combines CPU, auto-detected GPU, memory, storage, and network metrics into one compact Noctalia bar capsule. Subtle dividers separate non-empty groups, and values can use the global Noctalia system-monitor critical threshold for highlighting.
Plugin
| Field | Value |
|---|---|
| ID | tmelik/system-monitor |
| Entries | Bar widget: summary |
| License | GPL-3.0-only |
Requirements
psfrom procps/procps-ng for the optional top-process tooltip rows.cat(coreutils) for the CPU-frequency fallback used only when Noctalia doesn't report it.- Noctalia v5 with plugin API 26 or newer.
- The Noctalia system monitor service must be enabled.
Usage
- Open Noctalia Settings.
- Go to Bar, add a plugin widget, and select System Monitor.
- Place the widget in the desired section of the bar.
Left-click the capsule to open the System tab in Control Center. Hover it to see a two-column details table. Rows follow the capsule's CPU, GPU, memory, storage, and network order; CPU usage, temperature, frequency, and load are opt-in via show_cpu_details_in_tooltip since the capsule already shows enabled CPU metrics. RAM, swap, disk, and VRAM rows show utilization plus used / total amounts. The network row shows RX/TX accumulated during the current plugin session instead of repeating the live rates from the capsule. The final rows identify the highest CPU and RAM consumers.
Middle-click the capsule to open its settings. Each metric can be shown or hidden independently; GPU metrics default to auto (shown only when a GPU reports that field). You can also toggle category separators and the detailed tooltip, choose compact or explicit network units, select a network interface, choose percentage/used/available displays for RAM and disk, and change the monitored disk path. The default path is the root filesystem (/).
Unavailable sensors are displayed as an em dash instead of a misleading zero, or can be hidden. An unknown network interface is unavailable and never silently falls back to total traffic. RAM uses a distinct server-module glyph so it is easy to tell apart from CPU at a glance.
Settings
| Setting | Type | Default | Description |
|---|---|---|---|
show_cpu_usage |
bool |
true |
Show aggregate CPU usage. |
show_cpu_temperature |
bool |
true |
Show CPU temperature when a sensor is available. |
show_gpu_usage |
select |
auto |
auto/on/off. Auto shows GPU utilization when a GPU reports it. |
show_gpu_temperature |
select |
auto |
auto/on/off. Auto shows GPU temperature when a GPU reports it. |
show_gpu_vram |
select |
auto |
auto/on/off. Auto shows GPU VRAM usage when a GPU reports it. |
show_ram |
bool |
true |
Show RAM utilization. |
show_swap |
bool |
true |
Show swap utilization. |
show_disk |
bool |
true |
Show utilization for disk_path. |
show_download |
bool |
true |
Show aggregate receive rate. |
show_upload |
bool |
true |
Show aggregate transmit rate. |
highlight_values |
bool |
true |
Color glyphs and labels at Noctalia's activity and critical thresholds. |
activity_color |
color |
primary |
Color used from the activity threshold. |
critical_color |
color |
error |
Color used from the critical threshold. |
hide_unavailable |
bool |
false |
Omit individual metrics whose current value is unavailable. |
show_separators |
bool |
true |
Separate non-empty CPU, GPU, memory, storage, and network groups. |
show_tooltip |
bool |
true |
Show expanded metric names and values on hover. |
show_cpu_details_in_tooltip |
bool |
false |
Show CPU usage, temperature, frequency, and load in the tooltip. |
show_top_processes |
bool |
true |
Show the top CPU and RAM processes in the tooltip. |
compact_network |
bool |
true |
Use M/s-style labels; disable for MB/s-style labels. |
network_interface |
string |
"" |
Exact interface name; empty uses total non-loopback traffic. |
ram_display_mode |
select |
percentage |
Show RAM as percentage, used, or available. |
disk_display_mode |
select |
percentage |
Show disk as percentage, used, or available. |
disk_path |
string |
/ |
Select the filesystem whose utilization is displayed. |
Value highlighting
When highlighting is enabled, both the glyph and label use the normal widget color below the activity threshold, activity_color from activity up to critical, and critical_color at critical or above. Unavailable values are never colored. RAM and disk compare their usage percentage even in absolute display modes; network rates compare decimal MB/s.
The widget reads the effective system.monitor.*_activity_threshold and *_critical_threshold values on every update. Missing or invalid pairs use Noctalia's defaults: CPU usage 50/90, CPU temperature 60/85, GPU usage 50/95, GPU temperature 60/85, VRAM 50/90, RAM 60/90, swap 20/80, disk 80/95, and RX/TX 1/50 MB/s. A global critical threshold of zero disables highlighting for that metric, matching Noctalia's system-monitor behavior.
Notes
- The plugin only reads snapshots exposed by Noctalia through
systemStats()anddiskStats(), plus the globalsystem.monitorcritical threshold settings. - It does not access the network or write data.
- When
show_top_processesand the tooltip are enabled, it runspsasynchronously every five seconds. Only compact PID, short process name (comm), RSS, and accumulated CPU-time fields are requested; usernames, command lines, arguments, and environment variables are not read or displayed. - When
show_cpu_details_in_tooltipis enabled and Noctalia doesn't report CPU frequency itself, it falls back to reading/sys/devices/system/cpu/cpu0/cpufreq/scaling_cur_freq, then/proc/cpuinfoif that's unavailable, every five seconds. - Values refresh according to Noctalia's system-monitor sampling intervals; the widget redraws once per second.
- The tooltip includes only metrics that are both enabled and rendered. Its amount rows do not include available memory or sample age.
- Network session totals are estimated from Noctalia's sampled rates. They start at zero when the plugin runtime loads, do not persist across a Noctalia reload/restart, and are not system-uptime counters. An explicitly selected interface has its own session totals.
- If every metric is disabled, the capsule shows
No metrics. If enabled metrics are all hidden because they are unavailable, it showsNo data.
Development
Repository knowledge and the current handoff follow Google Open Knowledge Format v0.2. Start at knowledge/index.md.
Run the repository-local check before publishing:
python3 scripts/validate_okf.py
Versions
| Version | Plugin API | Updated |
|---|---|---|
| v1.5.2 latest | 26 | Sep 6, 2026 |
| v1.2.0 | 16 | Aug 24, 2026 |
Older versions stay installable on a Noctalia release whose plugin API is below the latest version's.