 Noctalia
About
Process Monitor
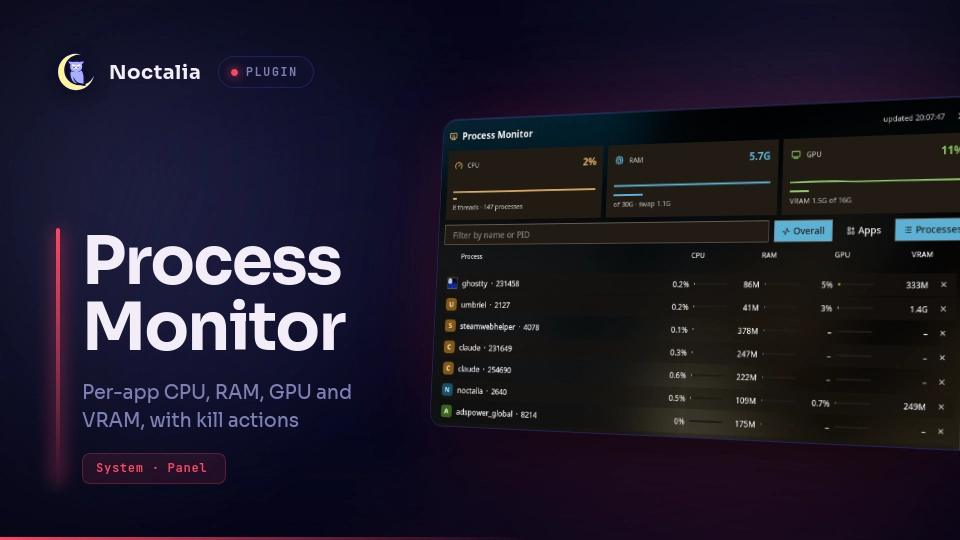
See which apps are using your CPU, RAM, GPU and VRAM right now: a compact bar readout, a sortable panel where you
can terminate, kill or pause processes, and a desktop widget. Per-process GPU and VRAM usage come from the kernel's
DRM fdinfo, the same counters nvtop and amdgpu_top read, so games and browsers show up with their real GPU load.
Plugin
| Field | Value |
|---|---|
| ID | yahya637/process-monitor |
| Entries | Bar widget: bar; panel: panel; desktop widget: desktop; service: sampler |
Requirements
python3(3.9 or newer) runs the sampler. It only uses the standard library.kill(from procps or util-linux) sends the terminate, force kill, pause and resume signals.- Linux with
/proc. The GPU parts need a driver that exposes DRM fdinfo; see GPU support.
Usage
Bar widget: add Process Monitor to a bar in Settings → Bar. It shows CPU, temperature, RAM, GPU and VRAM totals with small gauges that turn towards the error colour under load, followed by the busiest app. Hover for the top five apps; click to open the panel.
Panel: CPU, RAM and GPU cards with 60-sample history graphs, then a table of processes. Type in the filter box to search by name or PID, click a column header to sort (click again to reverse), and switch between Apps (processes of the same program added together) and Processes. Click a row for its actions: Terminate, Force kill (asks for a second click), Pause/Resume, and copying the PID or name. Right-click the ✕ at the end of a row for the same actions as a menu; clicking ✕ twice within 4 seconds terminates the process.
noctalia msg panel-toggle yahya637/process-monitor:panelDesktop widget: add Process Monitor in the desktop widgets editor. It shows totals, a CPU and GPU graph, sort chips (Overall, CPU, RAM, GPU, VRAM) and the top processes. Click the title to open the panel, or a row to open the panel filtered to that app. Hover a row to show its ✕ (two clicks to terminate). The sort you pick is remembered.
"Overall" ranks each app by whichever resource it strains most as a share of the machine: CPU of all cores, RAM of all memory, or GPU busy time.
Settings
Plugin settings (shared by every entry):
| Setting | Type | Default | Description |
|---|---|---|---|
interval_ms |
int |
2000 |
Sampling interval in milliseconds (500–10000). |
cpu_scale |
select |
machine |
machine: all cores together are 100%. core: one core is 100%, like top (a process using 4 cores shows 400%). |
group_by_app |
bool |
false |
Add up processes of the same executable into one row in the bar widget and when the panel opens. |
rows_per_metric |
int |
40 |
Advanced. The sampler sends the top N processes by CPU, RAM, GPU and VRAM. Raise it if the panel filter misses idle processes. |
Bar widget settings:
| Setting | Type | Default | Description |
|---|---|---|---|
display |
select |
both |
top (busiest app), totals (CPU/RAM/GPU), or both. |
metric |
select |
overall |
Which resource decides the busiest app: overall, cpu, ram, gpu or vram. |
max_name_length |
int |
16 |
Cut the app name after this many characters (0 = no limit). |
show_app_icon |
bool |
false |
Show the busiest app's icon (or its first letter) before its name. |
show_gauges |
bool |
true |
Show the small vertical gauges next to each total. |
show_temps |
bool |
true |
Show CPU and GPU temperature, from Noctalia's own system monitor. |
show_vram |
bool |
true |
Show VRAM usage as a separate total. |
Desktop widget settings:
| Setting | Type | Default | Description |
|---|---|---|---|
desktop_title |
string |
Processes |
Heading on the tile. Leave empty to hide the header row. |
desktop_rows |
int |
10 |
Number of process rows (1–20). |
desktop_sort |
select |
overall |
Initial sort: overall, cpu, ram, gpu or vram. |
desktop_group_by_app |
bool |
false |
Add up processes of the same executable into one row. |
desktop_show_totals |
bool |
true |
Show the CPU, RAM and GPU totals. |
desktop_show_graph |
bool |
true |
Show the CPU and GPU usage graph (last 60 samples). |
desktop_show_icons |
bool |
true |
Show app icons in front of names. |
IPC
Open the panel filtered to one app, with its actions shown:
noctalia msg panel-open yahya637/process-monitor:panel <app-name>
Notes
GPU support
- AMD (amdgpu): everything works: per-process GPU and VRAM, plus the machine-wide GPU busy and VRAM totals.
- Intel (i915) and other DRM drivers: per-process GPU usage is read from DRM fdinfo, but the machine-wide GPU card and totals are hidden, because they come from amdgpu-only sysfs files. Not tested on real Intel hardware.
- NVIDIA proprietary driver: it doesn't publish DRM fdinfo, so GPU columns stay empty. CPU and RAM work.
With several GPUs, the one with the most VRAM is monitored. Only your own processes' GPU usage is readable, which covers games and apps.
How the numbers are measured
- CPU:
utime+stimedeltas per process from/proc/<pid>/stat. - RAM:
RssAnon + RssShmem, i.e. private memory. Shared libraries are left out so that grouped apps add up sensibly, which makes the numbers lower than htop's RES. - Grouping: processes are grouped by executable, so a browser's renamed child processes stay together.
Interpreters (Python, Node, shells), Wine/Proton loaders and versioned binaries are grouped by process name
instead, so a Proton game shows as its
.exe.
What the plugin does on your system
- Processes started: one long-running
python3 sampler.py(about 0.4% of one core and 13 MB at the default interval), restarted if it exits;kill -TERM/-KILL/-STOP/-CONT <pids>only when you click an action; andnoctalia msg panel-openwhen the desktop widget opens the panel filtered to an app. - Files read:
/procand/sysonly (no root needed). The desktop widget also reads Noctalia's own desktop widget settings to size itself to its box. - Files written:
desktop.jsonin the plugin's data directory, holding the desktop widget's chosen sort. - Network: none.
Versions
| Version | Plugin API | Updated |
|---|---|---|
| v1.0.1 latest | 43 | Nov 5, 2026 |
Older versions stay installable on a Noctalia release whose plugin API is below the latest version's.