
About
NaN Usage
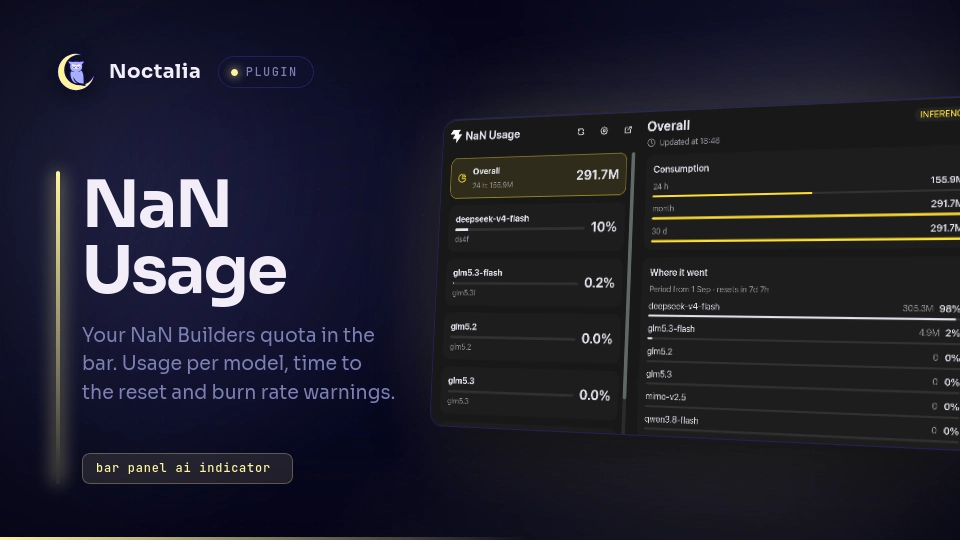
Your NaN subscription quota in the Noctalia bar: how much of each model's allowance is gone, how long until it resets, and whether the burn rate is heading for a lockout — with a panel of per-model detail behind it. The plugin talks to NaN's API itself.
Plugin
| Field | Value |
|---|---|
| ID | cmoro-deusto/nan-usage |
| Entries | Bar widget: bar; panel: panel; service: poller |
Requirements
A NaN API key, at ~/.config/nan/api-key by default. That is the file NaN's own
nan command line tool reads, so if you already use that, there is nothing to do;
another path can be set under Settings. Without a key the widget shows a dash and the
tooltip says which file is missing.
For the panel's link button, either gio (glib2) or xdg-open (xdg-utils) opens
NaN's dashboard in your browser. Neither is required: with neither installed the
button copies the address to your clipboard instead, and that behaviour can also be
chosen outright under Settings.
Usage
The bar widget shows the percentage of the model that is worst off and its time to reset. It is coloured by the burn rate rather than by the percentage alone:
your theme's own colour while the rate is fine,
amber once the average rate projects past 75 % by the reset, or once the quota would run out,
red once usage passes 90 %, or once that run-out would leave the account without quota for a tenth of the period or more.
Left click opens the panel. Pressing again closes it.
Right click opens these settings.
Hover lists the values: tokens used against the cap and the time to reset for each model, then one line per consumption period.
The gauge beside the text is what
panel_gaugesays:bar, ornonefor text only.
The panel has two columns: the account and its models on the left, the selected
one's detail on the right. Overall is the first entry and what the panel opens on;
it shows the aggregate consumption, one bar per period, and each model's share of
the period's tokens. Pick a model to see its percentage, a thicker bar, the time to
its reset, tokens used against the cap, and the reading of its burn rate.
Open the panel from anywhere, including a compositor key binding:
noctalia msg panel-toggle cmoro-deusto/nan-usage:panel
Settings
Set in Settings → Plugins (the gear on the plugin's row), or from the panel's own cog.
| Setting | Type | Default | Description |
|---|---|---|---|
api_key |
file |
~/.config/nan/api-key |
The file holding your NaN API key. |
interval |
int |
300 |
Seconds between requests to the NaN API. |
panel_model |
select |
worst |
Which model the bar reflects: the most alarming, the fullest, or a pinned one. |
panel_model_id |
string |
deepseek-v4-flash |
The model to pin, when panel_model is fixed. |
panel_gauge |
select |
bar |
The indicator beside the text: bar or none. |
show_percentage |
bool |
true |
The usage figure in the bar. |
show_reset |
bool |
true |
The countdown to the reset, in the bar. |
show_model |
bool |
true |
Which model the figure belongs to, abbreviated (ds4f). |
hide_unused |
bool |
false |
Drop models with no usage from the panel's list. |
show_metrics |
bool |
true |
The account-wide 24 h / month / 30 d totals, in the panel and the tooltip. Turning it off also saves the request. |
site_action |
select |
open |
What the link button does: open NaN's dashboard, or copy its address. |
show_icon |
bool |
true |
Draw the NaN mark in the bar. |
icon_style |
select |
ghost |
ghost draws the mark in the theme's own ink (white on a dark theme, black on a light one); color draws it as NaN does. |
show_glyph |
bool |
false |
Draw a glyph instead of the mark, when show_icon is off. |
glyph |
glyph |
chart-pie |
Which glyph, when show_glyph is on. |
show_tooltip |
bool |
true |
Show the details on hover. |
left_click |
select |
panel |
What a left click does: open the panel, or nothing. |
Notes
- Network. Three requests, once per
interval, all of themGETs tohttps://cloud-api.nan.builderswith your key as a bearer token:/api/usage/quota(every model's allowance, what is used, when it resets),/api/auth/me(the account handle, region and tier) and/api/metrics/usage(aggregate consumption over 24 h, the month and 30 d — skipped whenshow_metricsis off). Nothing else is contacted. - Sensitive data. Your API key is read from the file above, sent to that host as a bearer token over TLS, and held in memory. It is never logged, never shown in the tooltip or the panel, and never written anywhere. The responses are held in memory only, so a reload starts from nothing and shows a dash until the first request lands.
- Files written. None.
- Processes spawned. One, and only when you press the link button:
gio openorxdg-open, whichever exists, to hand NaN's dashboard to your browser. With neither installed the address is copied instead. Nothing else in the plugin starts a process, and no command has to be onPATHfor the widget or the panel to work. - Levels come from the rate, not the percentage. 80 % of a month on the third day is a warning, and so is a projection that lands past 75 %; running out is critical only when it would leave you without quota for a tenth of the period or more, because running out just before the reset is merely a bad day.
- One poller serves every monitor. The widget can be on several bars; the service is one entry per plugin, so the API traffic does not multiply.
- Compositors. Nothing here is compositor-specific: the plugin uses the bar, panel and service APIs and no IPC to any window manager, so it behaves the same under any compositor Noctalia supports.
- When something is wrong the last good numbers stay on the bar and the tooltip says so, together with the reason: a missing key, a rejected key, an unreachable API, or an answer that could not be read.
- Debugging. The panel logs one line when it loads and the service logs the
reason for every failure, both prefixed
NaN Usage— grep Noctalia's log for that (where it writes one depends on how the shell was started on your setup). Noctalia also logs every prop or control it skips. If the bar shows a dash, the tooltip names the reason first, and if the NaN mark never appears this Qt build has no image support — seticon_styleto a glyph instead. - Community project, not official: not affiliated with or endorsed by nan.builders. "NaN" and its logo belong to their owners, and the logo shipped here — the SVG the rasters are drawn from — derives from their public favicon. MIT-licensed.
Tests
Run from this directory:
lua tests/shared_test.lua          # the model, under a fixed clock, with no host
lua tests/plugin_test.lua          # the three entries against stubs of the API
python3 tests/plugin_check.py      # reads the manifest, the translations and the scripts
The first is the model on its own: levels, projections and every text, asserted exactly — which is only possible because the model takes the current time as an argument instead of reading a clock.
The second drives the real service.luau, bar.luau and panel.luau: that the
poller reads the key, asks the endpoints, publishes what came back and keeps the
last good numbers when one fails; that the widget and the panel paint that data; that
the only thing ever spawned is the browser opener, and only when the link button is
pressed; and that a refresh is asked for over the shared state channel rather than by
running a program.
The third is static, and needs Python 3.11 or newer for its TOML reader: the
manifest against its own translation keys, the plugin directory against its id, and
every API member, ui control, ui prop, callback and translation key the scripts
use against Noctalia's own definitions, which it downloads — the check is skipped
without network. It also refuses a local function called above its own definition,
which is a nil global at runtime.
Versions
| Version | Plugin API | Updated |
|---|---|---|
| v1.0.0 latest | 22 | Sep 23, 2026 |
Older versions stay installable on a Noctalia release whose plugin API is below the latest version's.