
About
Link/IP Monitor
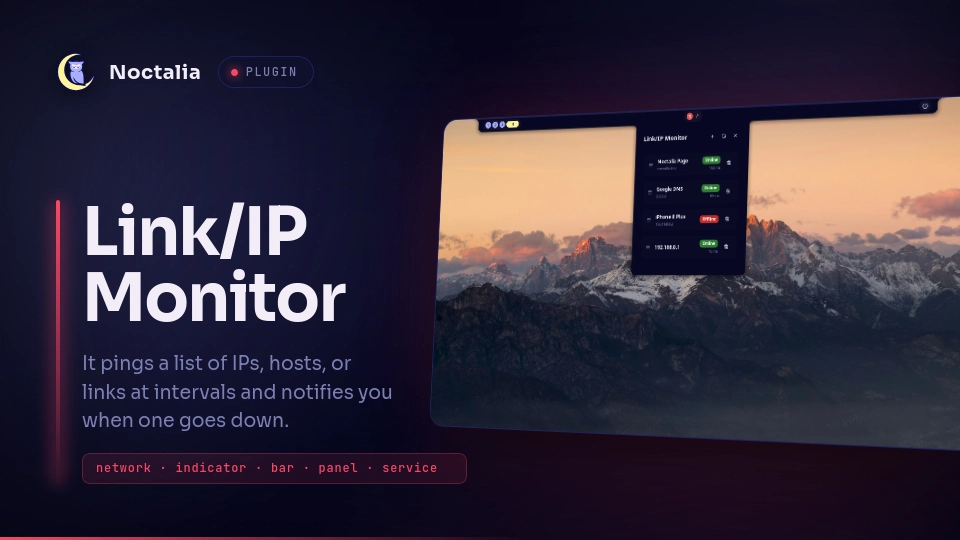
Pings a list of IPs, hostnames or links on an interval, tracks each host's online/offline status and response time, and notifies when one goes down or comes back up.
Plugin
| Field | Value |
|---|---|
| ID | nilsonlinux/link-ip-monitor |
| Entries | Bar widget: status; panel: panel; service: monitor |
Requirements
Uses the system ping binary (iputils, present on most Linux distros).
No other external dependency.
Usage
Add the status widget to the bar: it turns green when every monitored
host is responding, red with a count badge when one or more are down, and
neutral when the list is empty.
Click the widget to open the panel. Use the + button in the panel header
to reveal the add-host form — accepts an IP (8.8.8.8), a hostname
(example.com) or a full link (scheme, port, path and query are stripped
automatically, keeping only the host to ping). An optional description can
be set alongside it. The gear icon in the header opens the plugin's own
settings directly.
Each row in the panel shows the label (or the host, if no label was set), a status pill, the response time in ms while online — colored green under 100ms, yellow between 100 and 300ms, and red at 300ms or above — a drag handle to reorder the list, a pencil button to edit that entry's host and description (reuses the same form, pre-filled), and a trash button to remove it (asks for confirmation). Right-click the widget, or use the refresh button in the panel, to force an immediate check.
Open the panel directly with:
noctalia msg panel-toggle nilsonlinux/link-ip-monitor:panel
Force an immediate check via IPC:
noctalia msg plugin nilsonlinux/link-ip-monitor:monitor all refresh
The host list itself is not stored in plugin settings — it lives in the
service's own persisted state (pluginDataDir()/state.json) and is
managed entirely from the panel (add / edit / remove / reorder), since the
plugin API has no way to write settings back from a script.
Settings
| Setting | Type | Default | Description |
|---|---|---|---|
interval_seconds |
int |
30 |
How often each host is checked. |
timeout_seconds |
int |
1 |
How long to wait for a ping reply before treating it as a failure. |
notify_on_recovery |
bool |
true |
Send a notification when a host that was down responds again. |
colorize_latency |
bool |
true |
Colors the ms value by latency (green under 100ms, yellow 100-300ms, red 300ms+). Turn off to show it in a neutral color. |
glyph (widget) |
glyph |
activity |
Icon shown in the bar for the status widget. |
Notes
Notification text and panel labels come from translations/<locale>.json
via noctalia.tr() (English and pt-BR included; keys sorted
alphabetically at every level). noctalia.notify() / noctalia.notifyError()
accept only a title and body — the plugin API exposes no urgency
parameter, so the "host down" alert's appearance (the red border from
notifyError) can't be further customized from the plugin. Response time
(ms) is parsed from ping's own text output, so it depends on that output
containing a =<number> ms pattern regardless of the system's locale.
Versions
| Version | Plugin API | Updated |
|---|---|---|
| v1.0.2 latest | 14 | Sep 5, 2026 |
Older versions stay installable on a Noctalia release whose plugin API is below the latest version's.