 Noctalia
About
EasyTier Status
Show your EasyTier mesh VPN right in the Noctalia bar: how many peers are
online, which of them are reached directly, the best latency and the running
traffic. Open the panel for per-peer detail, the route table, connector status
and the subnet proxies. Everything is read from easytier-cli -o json; the
plugin never touches your EasyTier configuration.
Plugin
| Field | Value |
|---|---|
| ID | ylxc/easytier |
| Entries | Bar widget: status; panel: panel |
| Icon | network |
Requirements
easytier-clionPATH(declared inplugin.tomlas a dependency). It ships with EasyTier itself, so a working EasyTier install already has it. If it lives somewhere else, set the absolute path in thecli_pathsetting.- A reachable EasyTier RPC portal,
127.0.0.1:15888by default. The plugin only reads: it does not start, stop or reconfigure the core.
Verify the tool before adding the widget:
easytier-cli -o json peer
JSON output means the plugin can talk to the node.
Usage
Add the EasyTier widget from the Add-widget picker. By default it shows the
number of peers next to a network glyph, or offline while the core is not
running. Left-click it to open the panel; right-click forces an immediate
refresh. Both gestures can be rebound in the widget settings.
Hover the widget for a summary: network name, virtual IP, public address and NAT type, the peer/direct/relay counts, how many shared server nodes are reachable, best/average/worst latency, the lossy peers, accumulated traffic and the core version.
The panel opens as a floating window centred on screen:
noctalia msg panel-toggle ylxc/easytier:panel
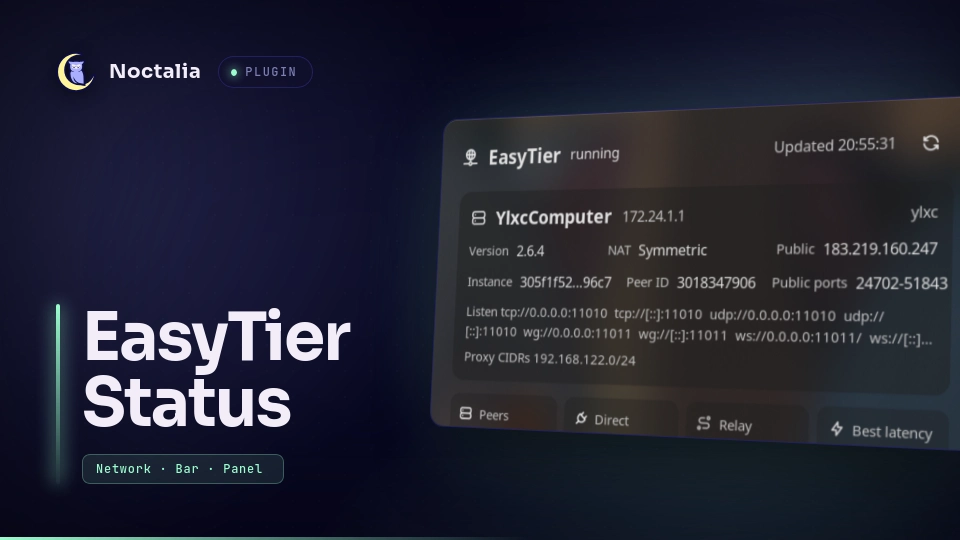
It is built from five sections. The self card shows the hostname, virtual
IP, network name, version, NAT type, public address and port range, instance
and peer ids, listeners and proxy CIDRs. The overview row gives peer,
direct, relay and latency tiles plus average/worst latency, lossy peers and
traffic. The Peers section lists every remote peer with its cost
(Local/p2p/relay), latency, loss, tunnel protocol, NAT type and traffic.
Servers, Routes and Connectors start collapsed and expand when you
click their headers. The refresh button in the title bar re-reads the CLI.
Shared server nodes (the public PublicServer_* relays of a typical EasyTier
network) are pulled out of the peer list into their own Servers section,
because they are infrastructure rather than devices of yours. Adjust the
server_prefix setting when your network names them differently.
Colours
The widget and the panel follow the same health scale:
- Normal — everything reachable, best latency under the warning threshold.
- Degraded (tertiary) — one of the shared servers is unreachable, best or
average latency is over the warning threshold, a peer is losing packets, or
a peer is reached through a relay (when
relay_warnis on). - Critical (error) — all shared server nodes are unreachable, meaning the public fallback path is gone. High latency or packet loss alone never paints the widget red; only losing every server does.
- Offline —
easytier-clicannot reach the core at all.
A server node counts as unreachable when its latency is at or above
crit_latency_ms or its packet loss is at or above loss_crit_percent. If your
network has no shared servers at all, the widget can reach Degraded but never
Critical.
Settings
| Setting | Type | Default | Description |
|---|---|---|---|
cli_path |
string |
empty | Absolute path to easytier-cli. Empty means the copy on PATH. |
rpc_portal |
string |
empty | RPC portal passed to -p, empty for 127.0.0.1:15888. Must match the core's --rpc-portal. |
instance_name |
string |
empty | Passed to -n. Only needed when one host runs several instances. |
instance_id |
string |
empty | Passed to -i. Prefer this over the name when you know the id. |
refresh_seconds |
int |
10 |
How often easytier-cli is called again, in seconds (2–600). |
warn_latency_ms |
int |
150 |
Best latency at or above this value, in milliseconds, shows as degraded. |
crit_latency_ms |
int |
400 |
A server node at or above this latency, in milliseconds, counts as unreachable. Winning over the warning threshold. |
relay_warn |
bool |
true |
Treat peers reached through a relay as degraded. |
loss_warn_percent |
int |
2 |
A peer at or above this packet loss, in percent, shows as degraded. |
loss_crit_percent |
int |
10 |
A server node at or above this packet loss, in percent, counts as unreachable. |
fetch_extras |
bool |
true |
Also read routes, connectors, proxies and port forwarding while the panel is open. Turn off for a lighter panel. |
max_peers |
int |
64 |
How many peers the panel lists before folding the rest behind an expand button. |
server_prefix |
string |
PublicServer |
Hostnames containing any of these comma-separated prefixes are treated as shared server nodes. |
notify_state_change |
bool |
false |
Send a notification when the mesh goes from working to unreachable, and back. |
Bar widget settings:
| Setting | Type | Default | Description |
|---|---|---|---|
display |
select |
status |
What the widget shows: peer status, peer count, direct/total, best latency, total traffic or the virtual IPv4. |
glyph |
glyph |
network |
Tabler icon drawn in the bar. |
show_glyph |
bool |
true |
Turn off to keep the text only. |
glyph_color |
select |
level |
level follows the health scale; the other options pin one theme role. |
hide_when_stopped |
bool |
false |
Hide the whole widget while the core is not running. |
IPC
The bar entry also accepts events, which is handy for keybindings:
noctalia msg plugin ylxc/easytier:status all refresh   # re-read easytier-cli now
noctalia msg plugin ylxc/easytier:status all panel     # toggle the panel
Notes
- Processes. Each refresh spawns
easytier-clionce per subcommand (two calls by default, six withfetch_extras), in parallel. The commands are launched as an argv array, never through a shell. - Read-only. The plugin only calls
easytier-cli ... -o jsonand parses the result. It writes no files and keeps no state on disk; everything is in memory. - Network.
easytier-clitalks to the core's local RPC portal. The plugin itself opens no sockets. - Privacy. Hostnames, virtual and public IPs, peer ids and traffic counters from your mesh are drawn on screen. They stay on your machine and are never sent anywhere.
- Panel layout. The panel root is a scroll container; keeping it that way avoids the host squeezing the list into a one-line strip.
- Debugging. Watch
~/.cache/noctalia/noctalia.logforloaded plugin 'ylxc/easytier'and anyluau_load failedline, and runnoctalia plugins lint ~/.local/share/noctalia/plugins/ylxc-easytierto cross-check the manifest against the code.
License
MIT
Versions
| Version | Plugin API | Updated |
|---|---|---|
| v1.0.0 latest | 43 | Nov 14, 2026 |
Older versions stay installable on a Noctalia release whose plugin API is below the latest version's.