
About
CuteMonitor — UPS Status
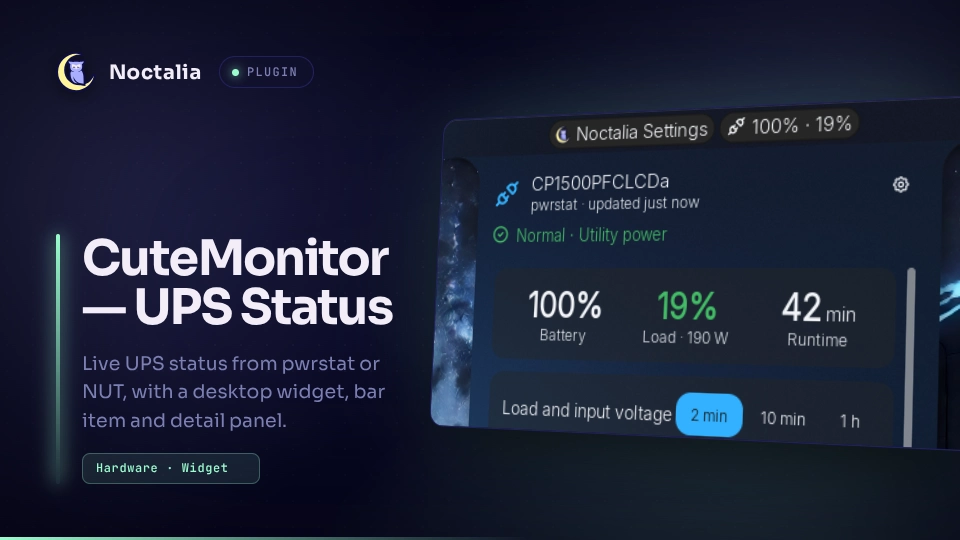
Live UPS status on your Noctalia desktop: battery, load, runtime, line quality and power
events, read from CyberPower's pwrstat or from NUT. Comes as a desktop widget, a bar item
and a detail panel that all share one background service.
Plugin
| Field | Value |
|---|---|
| ID | cutecaption/cutemonitor-ups |
| Entries | Desktop widget: desktop; bar widget: bar; panel: details; service: service |
Requirements
One data source, chosen automatically or in the plugin settings:
pwrstat— CyberPower PowerPanel for Linux, with itspwrstatddaemon running and the UPS connected by USB. Your user must be allowed to runpwrstat; Arch's AURpowerpanelpackage grants that to thepowergroup.upsc— the NUT (Network UPS Tools) client, reading a NUT server on this machine or on another one (name@host).
upscmd (part of NUT) is only used for the panel's actions when the data source is NUT;
it asks for your NUT username and password in a terminal.
Usage
Desktop widget. Open the desktop editor (Settings → Desktop → Widget Editor → Toggle
Editor, or noctalia msg desktop-widgets-edit), pick
CuteMonitor — UPS Status in the widget dropdown and add it. Choose a layout with
Display:
- Status — one or two big numbers with the power-source icon and a detail line.
- Graph — two history lines (default load and input voltage), like System Monitor.
- Gauges — up to three bars, as rows, columns or pills.
- Readout — the
pwrstat -statuslist, one switch per row.
Each layout shows only its own settings in the editor's inspector. Move, resize, rotate and the Background block work as for every built-in widget.
Bar item. Add CuteMonitor — UPS Status from the bar's Add-widget picker. Left click opens the detail panel; middle click opens the item's settings. During an outage the label adds the remaining runtime, and the colors switch to the Warning/Alert colors.
Detail panel. Opens from the bar item, or with:
noctalia msg panel-toggle cutecaption/cutemonitor-ups:details
It shows the big numbers, a live graph (2 min / 10 min / 1 h, hover for exact values), the full readout, the shutdown policy, the event log, and actions: Self-test (asks first), Mute and Alarm on/off. Every section can be switched off in the plugin settings.
Settings
Plugin-wide (Settings → Plugins → gear)
| Setting | Type | Default | Description |
|---|---|---|---|
data_source |
select | auto |
auto tries pwrstat, then NUT on this machine; or force pwrstat / nut. |
nut_ups |
string | empty | Empty uses the first UPS on this machine; name@host[:port] reads another machine. |
poll_interval |
select | 1 |
Seconds between readings: 1, 2, 5, 10, 30 or 60. |
high_load |
int | 80 |
Load percentage at which load values use the Alert color. |
date_style |
select | short |
short (Oct 5, 08:22, using your time format), pwrstat (2026/10/05 08:22:32) or relative (6 days ago). |
log_outages |
bool | true |
Log power failures, restorations (with duration), low battery, overload, faults. |
log_communication |
bool | false |
Log lost and restored contact with the UPS or NUT server. |
log_self_test |
bool | false |
Log self-test results. |
log_voltage |
bool | true |
Log Boost/Buck (automatic voltage regulation) switching on and off. |
log_line_events |
bool | true |
Log over/under voltage and blackouts as pwrstat reports them, including the most recent one missed while Noctalia wasn't running. |
Desktop widget (desktop editor inspector)
| Setting | Type | Default | Description |
|---|---|---|---|
display |
select | status |
Layout: status, graph, gauges, readout. |
big1, big2 |
select | battery_pct, load_pct |
Status: the big number(s); big2 can be none. |
number_style |
select | side_by_side |
Status: two equal numbers, or main_secondary. |
detail1–detail3 |
select | source, runtime, load_w |
Status: the detail line's items. |
line1, line2 |
select | load_w, input_v |
Graph: the two lines; line2 can be none. |
time_span |
select | 2m |
Graph: 2m, 10m or 1h of history (kept in memory only). |
show_label |
bool | true |
Graph: current values under the graph. |
gauge_layout |
select | rows |
Gauges: rows, columns or pills. |
bar1–bar3 |
select | battery_pct, load_w, runtime |
Gauges: the bars; each can be none. Runtime fills against the runtime reported at the last full charge. |
status_line |
bool | true |
Gauges: state and power source above the bars. |
row_* |
bool | current-status rows on | Readout: rows in pwrstat order, switched in the pairs pwrstat lists together (Model & Firmware, Ratings, State & Power Source, Voltages, Frequencies, Battery & Runtime) or alone (Load, Line Interaction, Test Result, Last Power Event); Model & Firmware and Ratings start off. Rows the UPS doesn't report are left out. |
extra_nut |
bool | false |
Readout: NUT-only battery voltage, charging state, beeper and transfer range. |
color, color2, color3 |
color | primary, secondary, on_surface_variant |
Colors for the first, second and third stat. Readout uses only color2, for its State row; color3 is for Gauges. |
warning_color, alert_color |
color | tertiary, error |
On battery; low battery, overload, fault and high load. |
Stats available in the dropdowns: battery %, load %, load (W), runtime, input/output voltage, input/output frequency.
Bar item
| Setting | Type | Default | Description |
|---|---|---|---|
display_mode |
select | icon |
icon (power source), battery (drawn battery) or none. |
battery_color |
color | on_surface |
Drawn battery only: its outline and charge. Outages and alerts use the Warning/Alert colors. |
show_label |
bool | true |
Show values next to the icon. |
label_content |
select | battery_load |
battery_load, battery, load, load_w or runtime. |
only_on_battery |
bool | false |
Hide the item unless the UPS is running on battery. |
warning_color, alert_color |
color | tertiary, error |
Colors for outage and alert states. |
Panel (Settings → Plugins → gear)
| Setting | Type | Default | Description |
|---|---|---|---|
panel_hero |
bool | true |
Big numbers. |
panel_graph |
bool | true |
Live graph. |
panel_readout |
bool | true |
Full readout. |
panel_protection |
bool | false |
Shutdown policy and alarm state. |
panel_events |
bool | false |
Event log. |
panel_actions |
bool | true |
Self-test, Mute and Alarm buttons. |
IPC
noctalia msg plugin cutecaption/cutemonitor-ups:service all simulate on_battery
simulate previews a state without touching the UPS: on_battery, low_battery,
overload, lost, no_ups, or off to return to live data. It only changes what is
displayed — nothing is logged or saved — and works on a machine without a UPS.
noctalia msg plugin cutecaption/cutemonitor-ups:service all refresh
Reads the UPS now (or looks for one again).
noctalia msg plugin cutecaption/cutemonitor-ups:service all dump
Writes the service's current state to Noctalia's log, for troubleshooting.
Notes
- Commands run:
pwrstat -statusevery poll andpwrstat -configevery 10 minutes; orupsc <ups>every poll andupsc -lwhile looking for a UPS. Panel actions runpwrstat -test,pwrstat -muteandpwrstat -alarm on|off, orupscmdin a terminal for NUT. No shell is involved except that terminal command, and NUT UPS names are validated before use. - Files written:
events.json(the newest 200 log entries) andstate.json(the last self-test, the last full-charge runtime and the newest pwrstat event seen) in the plugin's data directory. Graph history stays in memory. - Network: none, except the NUT client talking to the configured NUT server.
- States: values dim with "Lost communication · last data N s ago" when the data source
reports lost communication or three readings in a row fail; with no UPS at all the
widget says why (for example
pwrstat isn't installed). - Self-test briefly switches the UPS to battery. The plugin never changes your shutdown policy (pwrstatd or NUT's upsmon); the panel only displays it.
Versions
| Version | Plugin API | Updated |
|---|---|---|
| v0.1.0 latest | 29 | Oct 14, 2026 |
Older versions stay installable on a Noctalia release whose plugin API is below the latest version's.