
About
AI Usage
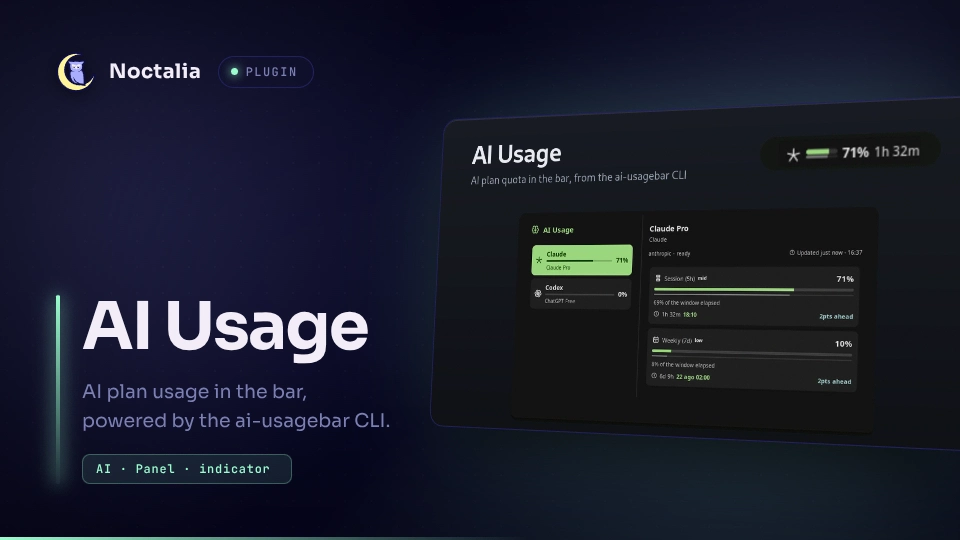
Track AI plan usage, quota resets, and consumption pace in the Noctalia bar.
The numbers come from ai-usagebar,
a Rust CLI that reads Claude, Codex, GitHub Copilot, Cursor, Antigravity, Kiro,
Z.AI, Nous Research, OpenCode Go, Command Code, OpenRouter, DeepSeek, Kimi and Grok, among
others. The plugin runs ai-usagebar usage --json and displays the report.
It does not call provider APIs or read credential files.
Plugin
| Field | Value |
|---|---|
| ID | felipeartur/ai-usagebar |
| Entries | Bar widget: bar; panel: panel; service: poller |
Requirements
Install ai-usagebar on PATH. The plugin runs it by name and has no separate
path setting. It ships as ai-usagebar-bin on the AUR, and as release
tarballs on the project's GitHub Releases page. Configure your providers once in
~/.config/ai-usagebar/config.toml; the CLI manages credentials and provider
connections.
The CLI can send its own quota notifications when this plugin polls it. To
disable them, add this to ~/.config/ai-usagebar/config.toml:
[notifications]
enabled = false
When the CLI is missing, the panel displays its project address and can open it
with xdg-open. The same command opens provider dashboards from the panel.
Install xdg-open alongside ai-usagebar.
The plugin requires plugin API 22 for require(). It will not install on an
older shell. Plugin version 1.1.0 remains available for API 9.
Usage
Add felipeartur/ai-usagebar:bar to a bar in Settings, Bar. The capsule shows
one provider's headline percentage beside its icon. Readings use the bar's text
color, the theme's secondary color for high usage, and error for critical
usage. Icons keep their normal color unless a read fails.
Automatic selects by headline severity, then usage. Raise provider_limit to
show more providers; limits above one also show +N for providers that do not
fit. Pin a provider or add another widget instance to keep particular plans
visible.
Named accounts use the label from the CLI config. Pick the provider and put the
label in account: vendor = "openai" with account = "work" follows the
openai@work report entry. Leave it empty for the provider's default account.
Settings use the same names as the core sysmon widget. Set visualization to
gauge for a usage bar above a thinner elapsed-time bar, or none to hide it.
Usage ahead of elapsed time means consumption is ahead of pace. show_value,
show_glyph and glyph_position control the percentage and icon placement,
including Antigravity's individual model readings.
extras adds the reset countdown (3h 51m), consumption pace (↑3 means three
percentage points ahead of elapsed time; ↓3 means three behind), both, or
neither. Countdowns show days and hours from 24 hours onward, and hours and
minutes below that.
When editing config.toml by hand, create a named instance. A raw widget id in
the bar list creates an anonymous instance with no settings of its own:
[widget.ai_usage]
type = "felipeartur/ai-usagebar:bar"
visualization = "gauge"
provider_limit = 2

[bar.default]
start = [ "clock", "ai_usage" ]
- Hover shows session and long-window values with a reset countdown per model.
- When a long window is exhausted, the capsule replaces the short-window value
with
100%and counts down to the blocking window's reset. If several windows are exhausted, it uses the latest reset. A critical warning below 100% does not count as exhaustion. - Left click opens the
AI Usagepanel for the provider that capsule tracks. - Right click requests a refresh. One poller serves every capsule and keeps at most one pending refresh when requests arrive during a read.
- Middle click opens the widget's settings, as everywhere else in the shell.
The script handles left and middle clicks. Right click is a gesture binding in
the widget settings, where you can assign another action or choose none.
The panel shows provider tabs at the top and the selected provider's limits
below. With more than three providers, tabs show icons only and reveal names on
hover. Session and weekly limits share a card; Antigravity has a separate card
for each model. Each window shows usage above a thinner elapsed-time bar.
A longer usage bar means consumption is ahead of the window's pace.
The shared Claude & GPT OSS quota keeps the name supplied by the CLI.
The row beside the update time shows quota status for every provider: a quiet icon through 50% usage, then one compact pill per model above 50%, showing its most restrictive window. Hover a pill for its full status and reset countdown. Read failures show the last known state. The panel displays quota readings, not agent process health.
The header stays fixed while longer reports scroll. Every provider reserves the same space beside its cards, so the scrollbar does not change their width.
Opening the panel requests fresh data. The header shows when the last reading arrived, refresh and settings buttons, and a link to the selected quota service. For Antigravity, both model groups share that service link. Click outside or click the widget again to close the panel.
The list contains only providers with a usable reading. A provider the CLI reports no API key for never appears, because it was never set up. A configured provider with its own refresh failure also leaves the bar and panel, then returns automatically after a healthy read. The panel sorts providers by headline severity, then usage; equal readings keep the CLI's order. Automatic bar selection uses the same priorities, then the configured primary provider and account id.
Antigravity is the exception when its local server briefly disappears: the last reading stays visible with a stale indicator and its original update time until the server returns. Without an earlier reading, it stays unavailable.
Parser errors are an exception: the provider remains visible with missing usage and the CLI error, because a response-format failure does not establish that the account is unavailable.
Details include the plan and account name, reading age, stale status, window labels, percentages, elapsed time, reset countdowns and local reset times, pace, and high or critical severity labels. Raw values appear when they add information to the percentage. Credit blocks and free text are also shown; zero credit balances are hidden. Codex reset credits show the reset type and expiry on separate lines, with wrapping for longer descriptions.
A whole-report failure is different: it cannot identify one broken provider, so it keeps the last list and marks those readings as old instead of blanking the panel during a network interruption.
To open the panel from a terminal:
noctalia msg panel-toggle felipeartur/ai-usagebar:panel
Settings
Plugin-level, shared by the poller, every capsule and the panel:
| Setting | Type | Default | Description |
|---|---|---|---|
refresh_minutes |
int |
5 |
Minutes between CLI calls, from 1 to 120. Countdowns tick locally in between. |
Per widget instance, so two capsules can follow two providers:
| Setting | Type | Default | Description |
|---|---|---|---|
vendor |
select |
auto |
Which plan this capsule tracks. auto follows the busiest provider, with the CLI's own [ui] primary breaking ties. |
account |
string |
empty | Optional named account label from the CLI config. Ignored on auto. |
visualization |
select |
none |
gauge or none, as described above. |
show_value |
bool |
true |
Show the percentage as text. |
show_glyph |
bool |
true |
Show the provider's icon. |
glyph_position |
select |
before |
before or after the reading. |
provider_limit |
int |
1 |
How many providers one capsule carries, busiest first, from 1 to 4. Only applies on auto. |
extras |
select |
countdown |
Information beside the percentage: countdown, pace, both or none. |
show_name |
bool |
false |
Show the provider name beside the reading. |
color_by_usage |
bool |
true |
Color readings by quota severity. Turning it off does not hide error indicators. |
IPC
Force a refresh without waiting for the interval:
noctalia msg plugin felipeartur/ai-usagebar:poller all refresh
Point the panel at a provider, by the id ai-usagebar uses for it:
noctalia msg plugin felipeartur/ai-usagebar:poller all select anthropic
Notes
- One process,
ai-usagebar usage --json, spawned by a single headless service on the configured interval, plus on demand from a right click, from opening the panel, or from the IPC event above. Capsules and the panel are subscribers of plugin state, so a second monitor or a second capsule costs no extra process. - The plugin makes no network calls and writes no files of its own. Everything it knows arrives on that command's stdout.
- A provider whose service is down leaves the bar and panel on the first report
that says so, except for Antigravity's temporary local-server loss described
above. It is not counted behind the
+n, and returns when a report carries a healthy reading for it again. - A failed whole-report read keeps the previous report and marks it as stale. Without a previous report, the panel shows the failure and its scrubbed diagnostic. Raw HTTP details stay out of the reading cards.
- Report text is scrubbed for common credential patterns before publication to plugin state. This is a precaution, not a guarantee that arbitrary CLI output contains no sensitive data. Review account labels and diagnostics before sharing screenshots.
Tests
Run the tests from the ai-usagebar directory:
lua tests/scrub_test.lua
lua tests/refresh_test.lua
lua tests/bar_test.lua
lua tests/panel_test.lua
TZ=America/New_York lua tests/shared_test.lua
The first test reads safeText and scrub out of service.luau rather than
copying them, then checks that real credential shapes never survive, that ordinary
readings pass through unchanged, and that scrubbing a four-vendor report stays
inside the CPU budget the poller's async callback is given. The second exercises
the coalesced refresh state, rejects output from a timed-out process, checks
quiet quota changes, and checks that every provider has a glyph of its own.
The third drives the real bar script through default, named, missing and automatic
account selection, plus malformed metrics. The fourth checks that malformed panel
sections degrade safely. The fifth verifies UTC parsing through a daylight-saving
transition. An overrun in the first test loses the whole reading, not just time.
Versions
| Version | Plugin API | Updated |
|---|---|---|
| v2.3.1 latest | 22 | Sep 25, 2026 |
| v1.1.0 | 9 | Aug 17, 2026 |
Older versions stay installable on a Noctalia release whose plugin API is below the latest version's.