Network Indicator
A `lively` network traffic indicator.
About
NetworkIndicator Plugin for Noctalia
A Noctalia bar widget that displays current network upload (TX) and download (RX) activity. Includes optional live throughput values and a hover-activated graph panel.
Features
- TX/RX Activity Indicators: Icons for TX and RX with active/idle coloring based on a configurable traffic threshold.
- Vertical and Horizontal Layouts: Configurable cell grid: arrange up to four cells (TX icon, RX icon, TX speed, RX speed) in a horizontal row or a 2×2 grid. Cells can be left empty to show only icons or only values.
- Network Graph Panel: Click on the widget to open a live graph panel showing recent RX and TX history.
- Custom Font: Override the default font for speed values, with optional bold and italic styles.
- Theme Support: Uses theme colors by default; all colors can be overridden individually.
Installation
This plugin is part of the noctalia-plugins repository.
Configuration
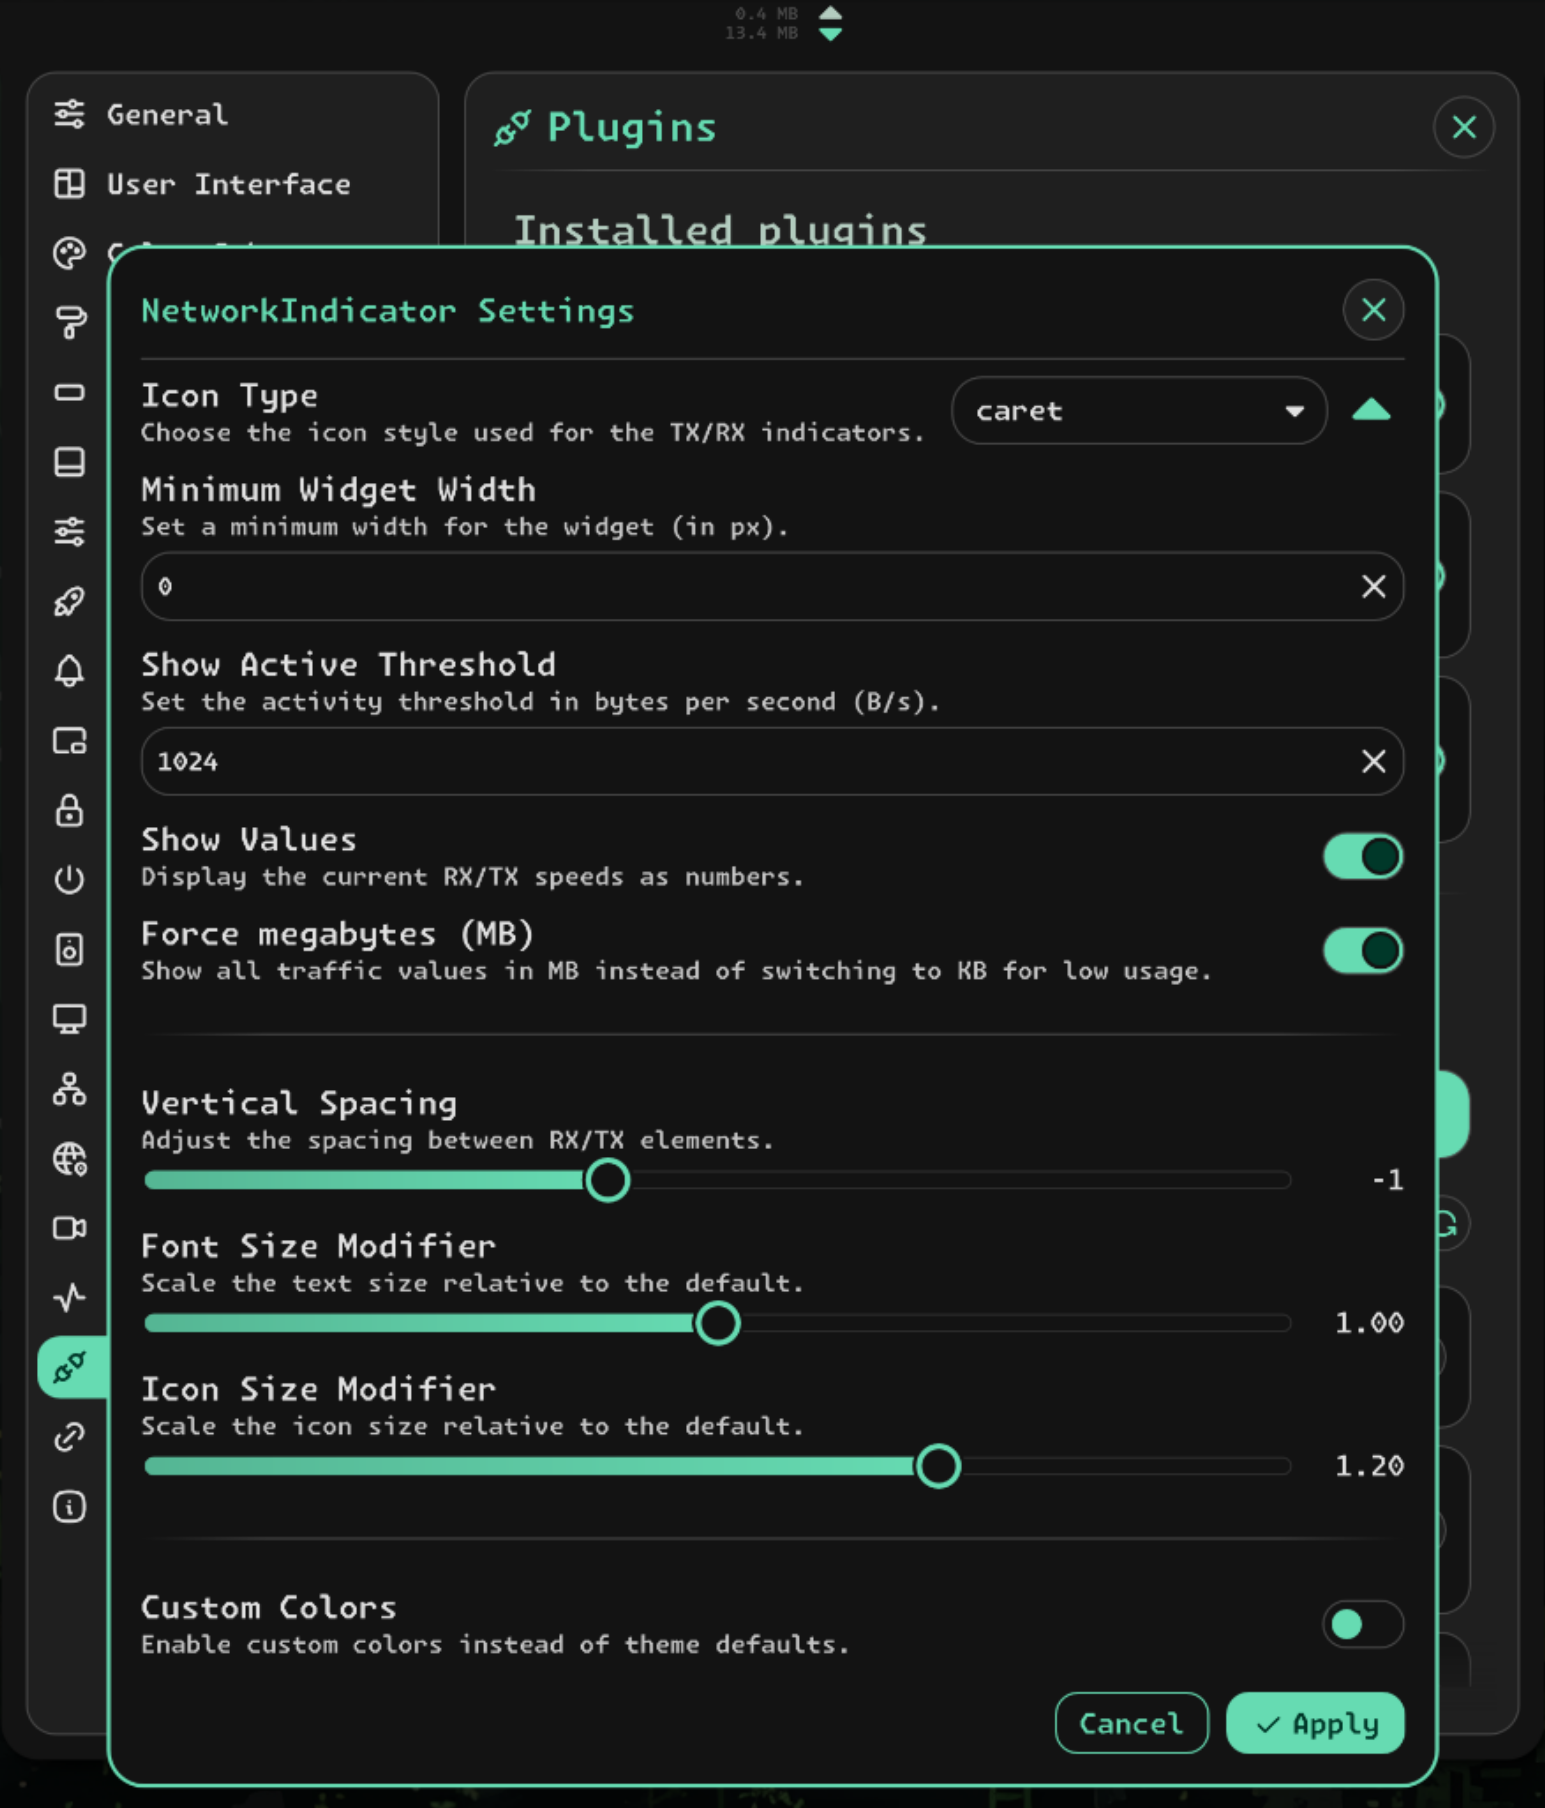
Access settings through the widget's context menu.
Layout: Choose between horizontal (single row) and vertical (2×2 grid) cell arrangement.
Cell Assignment: Assign what each cell displays. Duplicates are not allowed. Use empty cells to reduce the widget to just icons or just speed values.
Icon Type: Select the icon style for the TX/RX indicators (arrow, arrow-bar, arrow-big, arrow-narrow, caret, chevron, chevron-compact, fold).
Activity Threshold: Traffic below this value (B/s) is treated as inactive, and icons switch to the idle color.
Font & Icon Size: Scale text and icon sizes relative to the defaults.
Custom Font: Override the default font for speed values, with optional bold and italic.
Custom Colors: Override theme colors for TX active, RX active, inactive, and text individually.
Spacing & Padding: Adjust left/right padding, column spacing, and row spacing.
Usage
- Add the widget to your Noctalia bar.
- Left-click the widget to open the network graph panel.
- Right-click the widget to access settings.
- Configure the plugin settings as required.
Requirements
- Noctalia 4.7.6 or later.
Technical Details
- The widget reads
SystemStatService.txSpeedandSystemStatService.rxSpeed; the polling interval is determined by that service. - The graph panel uses
SystemStatService.rxSpeedHistoryandSystemStatService.txSpeedHistorywithNGraphfrom the Noctalia Shell. - Unfortunately, the update interval
SystemStatService.networkIntervalMsis currently hardcoded to3000by Noctalia.